Overview of Applications:
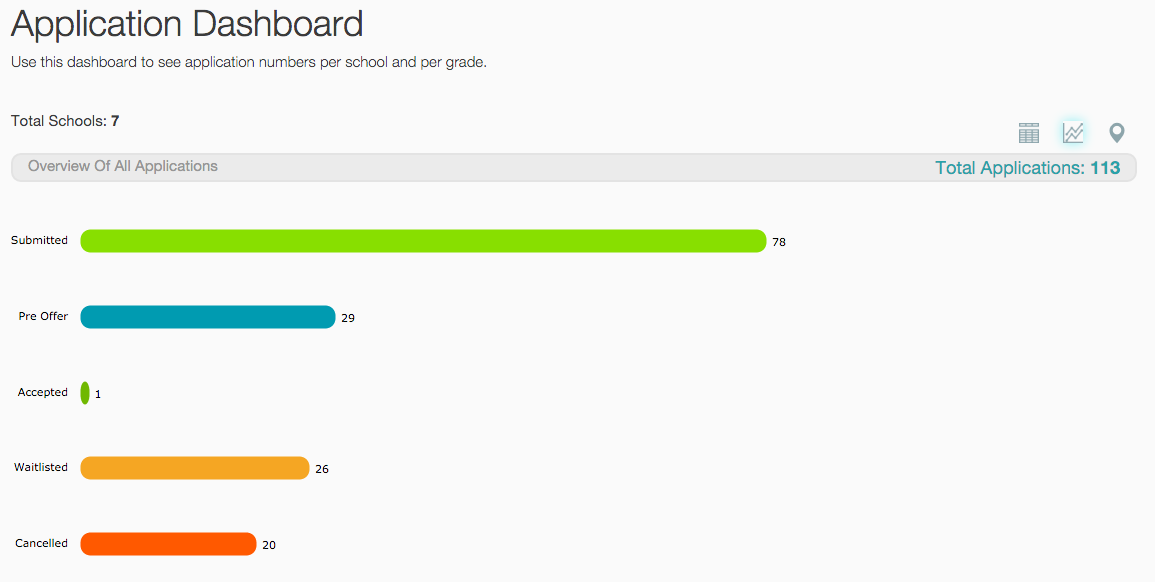
The Overview of Applications section of the Application Dashboard can be found by clicking on the Dashboards tab then and the Application Dashboard menu item and clicking on the graph view:

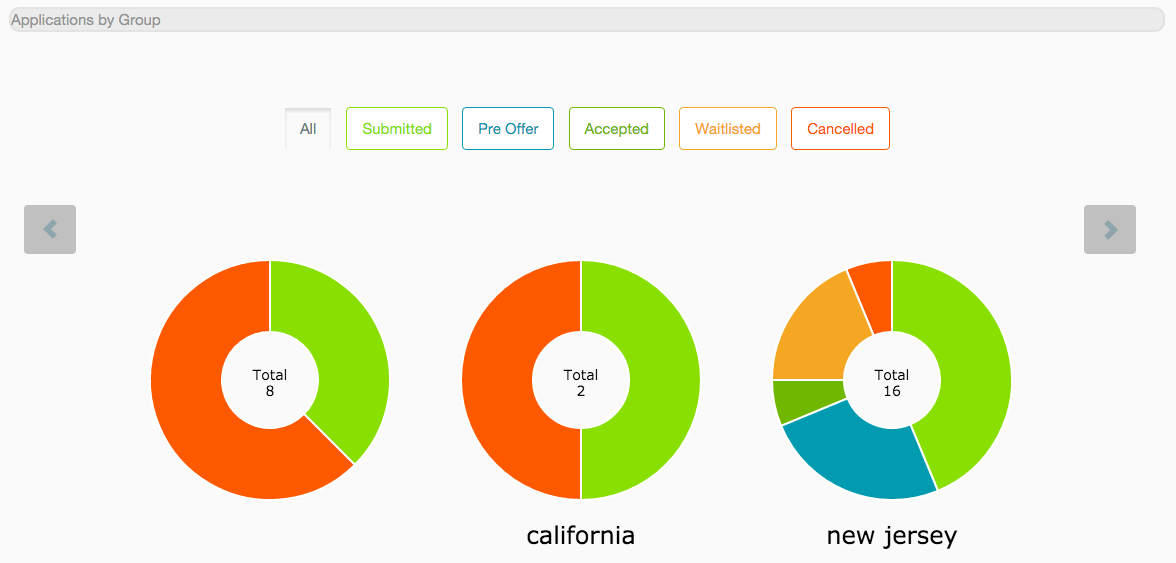
There are three different graphs that offer insights to your application pool. Notice that the color in each graph corresponds to a specific application status.
The first bar graph details the number of applications that are currently in each application status.
A total count of applications can be found on the right in blue font.

If you have enabled Groups, the next section breaks down the application pool by group. In the case below, the charts are organized by the state the schools are in. 
Lastly, the third graph shows applications - and their current statuses - by specific school.
This allows you to see the number of students in each application status at each designated school.

------------------------------------------------------------------------------------------------------
Still have questions? Email us at support@schoolmint.com.

Comments
0 comments
Article is closed for comments.